Cumulative Plot
Simple script for creating layered cumulative plots using T-HIS datums.
Simple script for creating layered cumulative plots using T-HIS datums:
- When running this script the user selects a number of curves.
- The curves are sorted into descending order based on their peak values.
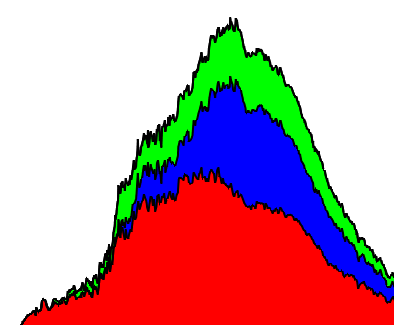
- Datums are created to give the appearance of the curves being layered on top of each other (largest at the bottom, smallest at the top).
- Datum colours are taken as curve colours and the user is asked whether they would like dummy curves to be created to create a legend (since using the original curves as the legend conflicts with the datum plot).