
Oasys T/HIS
Streamline your graph processing and analysis
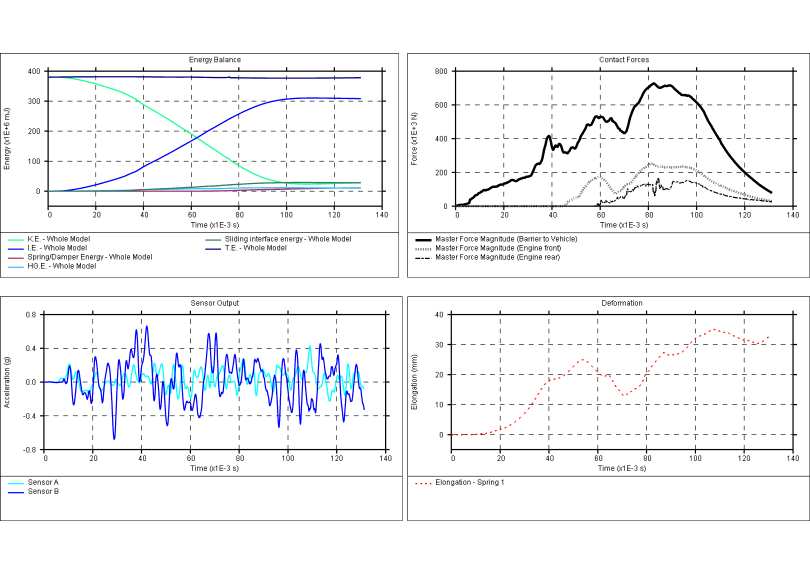
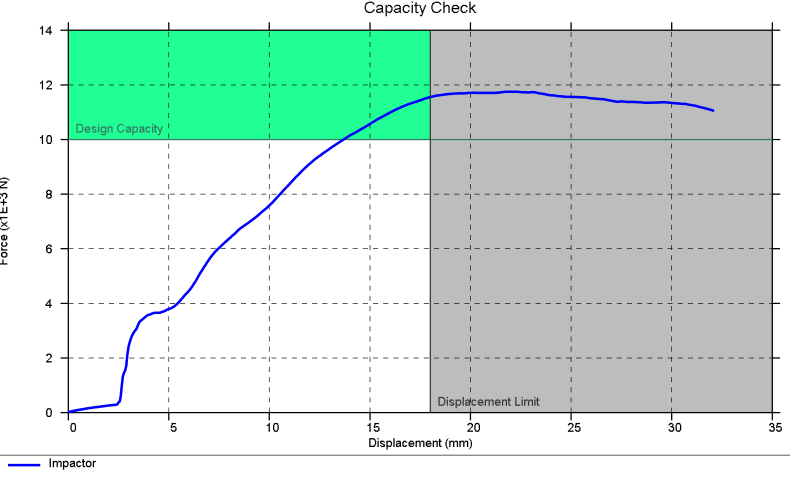
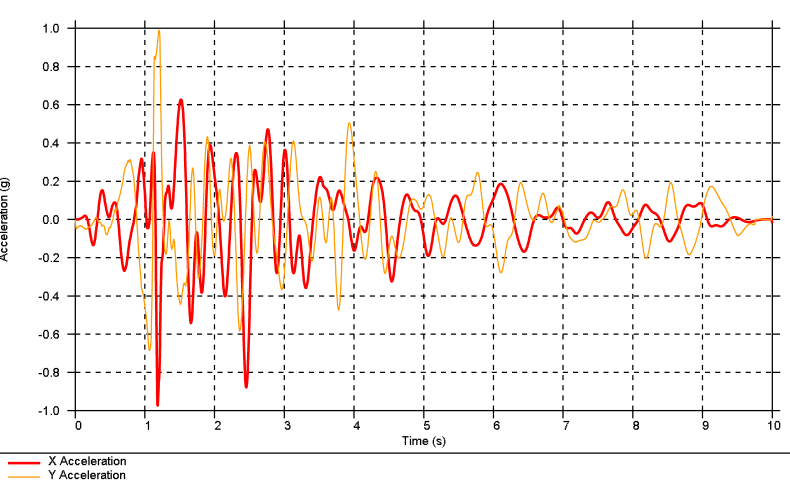
Efficiently plot graphical data from any Ansys LS-DYNA analysis and easily compare test and simulation results. Rapidly process data in bulk or link with Oasys D3PLOT to plot graphs alongside 3D results.
At a glance
- Post-processing
- Graph processing / analysis
- Plotting
- 3D results
Model
Analyse
Visualise

In-built automation
Automate your data processing with self-generating scripts – no coding required. Processing steps are automatically recorded for repeat operation in subsequent Oasys T/HIS sessions.

Powerful data processing algorithms
Oasys T/HIS simplifies data processing with built-in mathematical, filtering, and industry-specific functions — helping you quickly transform raw data into clear, reliable insights with reduced effort and complexity.
SimVT
Oasys T/HIS includes SimVT, a powerful tool for correlating curves from different data sources. For CAE engineers working to efficiently meet the correlation requirements of the latest Virtual Testing protocols, SimVT is the solution.
Latest Webinars
Register for our upcoming webinars or watch back recorded sessions.
Looking for more Webinars? View our Webinars archive
Case Studies
Discover how our software is supporting users to solve complex engineering challenges
-
Simplifying design processes: Using simulation to maintain a competitive edge in tanker manufacturing
-
-
Game-changing redesign to floating solar panels supports sustainable food production across Northern Europe
Features & capabilities
Explore the capabilities of Oasys T/HIS that increase the performance of leading CAE teams.
Frequently Asked Questions
T/HIS is short for “time history” – most of the XY data from LS-DYNA output is a time history of your simulation, but T/HIS can process XY data in the frequency domain, or indeed any XY plot.
Find out how Oasys T/HIS can accelerate your workflow
Contact a sales representative now.

Oasys T/HIS Documentation
Documentation for Oasys T/HIS
-
Oasys Suite 22.1 Release Notes
-
T/HIS 22.1 Manual
-
T/HIS 22.1 New Features
-
Python API 22.1
-
JavaScript API 22.1


